YOUTUBE ANALYTICS BASICS (How to read your YouTube Analytics & optimize content)
“How does YouTube Analytics work?”
“How can I grow my YouTube Channel?”
“How do I determine what content to create on YouTube?”
Youtube has grown to become one of my favourite platforms.
The community, the engagement and dare I say… the BEST analytics dashboard I’ve ever seen.
There is just so much I love about Youtube.
But if you think posting content consistently and guessing the right keywords and hashtags are enough to grow your brand.
Think again.
If you’re serious about growing your brand in 2021 (and beyond), you’re going to need a little more than consistent posting and simple guesswork.
Which is why in this blog, we’re going to do a deep dive into the basics of YouTube Analytics.
Yup… you’ve got it!
I’ll cover the basics of YouTube analytics, key metrics, and how to interpret them.
You’ll also learn how to leverage all that knowledge to optimize your content, and deliver content that will grow your brand.
Let’s get into it!
As always, if you’d prefer to watch or listen to me, feel free to hit play and pause as needed ⬇️:
YOUTUBE ANALYTICS BASICS EXPLAINED 2021: How to read your Youtube Analytics & optimize content
YouTube Analytics Overview
There are many different sections within Youtube Studio.
Here are the main analytics metrics that you should keep in mind:
- Channel Metrics
- Video Metrics
- Audience Metrics (demographics, age, location)
- Engagement Metrics
- Revenue Metrics
YouTube Analytics Basics
Let’s go over the channel dashboard’s latest video performance, and the channel analytics sections.
Channel Dashboard
From the YouTube homepage, click on your account’s avatar and select YouTube studio from the drop-down list.
From there you’ll be directed to your studio dashboard, which is divided into a few sections.
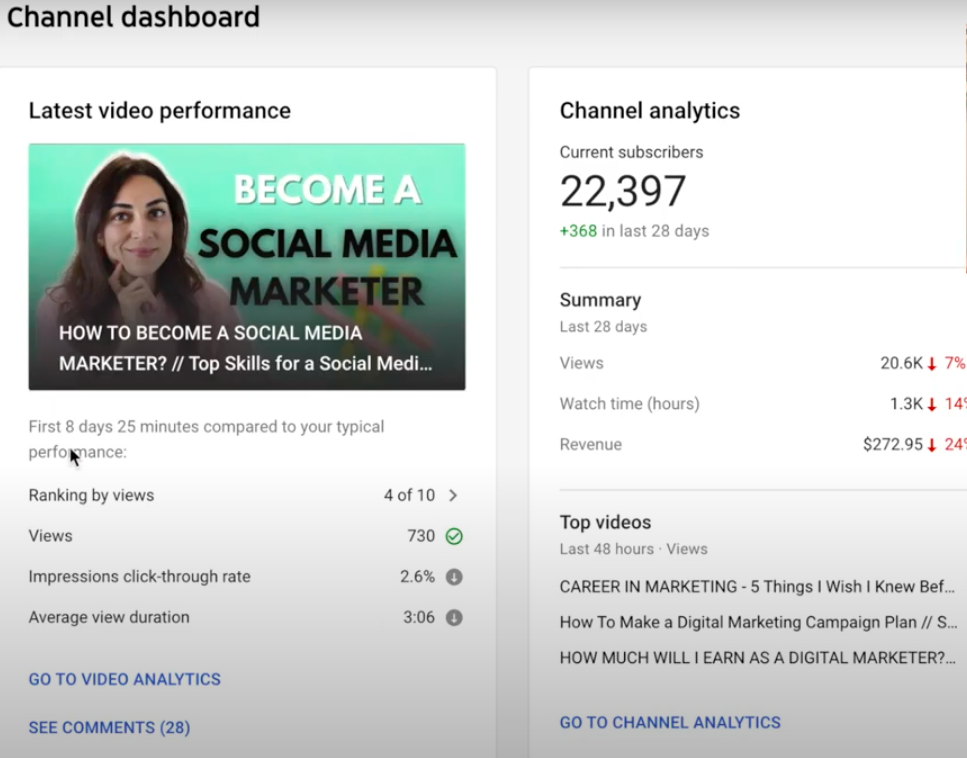
Latest performance

The latest video performance panel shows you at a glance how your most recent video is performing overall, and across the latest 10 videos that you have on your channel.
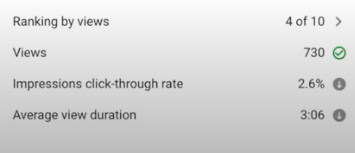
You can also browse through the following key metrics that YouTube pays attention to:
- Views
- Impression click-through rate (CTR)
- Average view duration
Channel Analytics
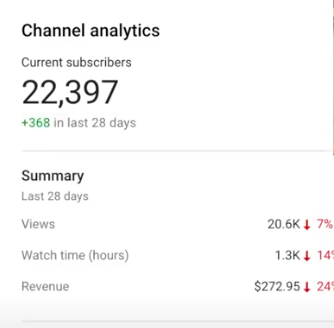
Here you’ll get a snapshot of your channel analytics over the last 28 days (by default) – I’ll go into detail about how you can toggle this here.
You’ll also see:
- the total views within the time frame you’ve selected;
- watch time;
- and the estimated channel revenue for the month.
Channel Analytics: Overview
Now, let’s get a more detailed snapshot of your channel.
If you hit the ‘go to channel analytics’ option under your top videos section or the analytics tab on the left.
You’ll see something like this. This is where you can visualize how your channel is doing in greater detail.
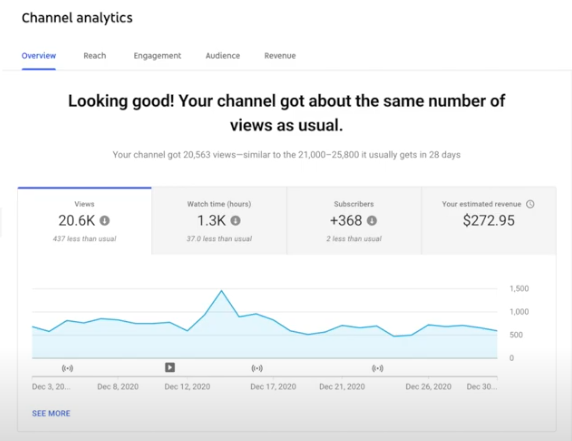
1. Watch Time
The grey icons on the bottom are the videos that you have uploaded within that range.
But I want you to pay attention to the watch time (hours).
Why?
Because YouTube’s main goal is to keep people on the platform.
So, if you can increase the amount of time people spend watching your videos, the platform will reward you by recommending it to other people.
This will in turn increase the reach of your video.
2. Realtime data
If you look on the very top right hand corner on the channel analytics page, you’ll also see a range which is set to the last 28 days (by default).
This is where you can toggle the range however you want (28 days, 30 days, etc.) to better understand your data within that time frame.
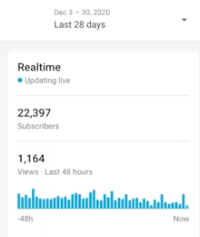
Want to see what times your YouTube video do best?
Click on the little blue bars to find out the ideal time to post your videos.
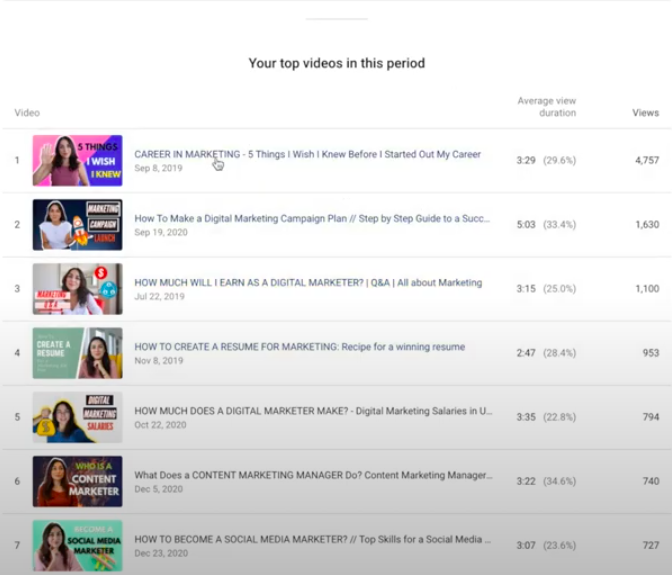
3. Top videos in this period
On the lower half of the channels analytics page, you’ll see your top videos for the period you’ve selected.
This will give you a good idea of the type of content people like watching on your channel, but it’s not everything.
Channel Analytics: Visualizing Data
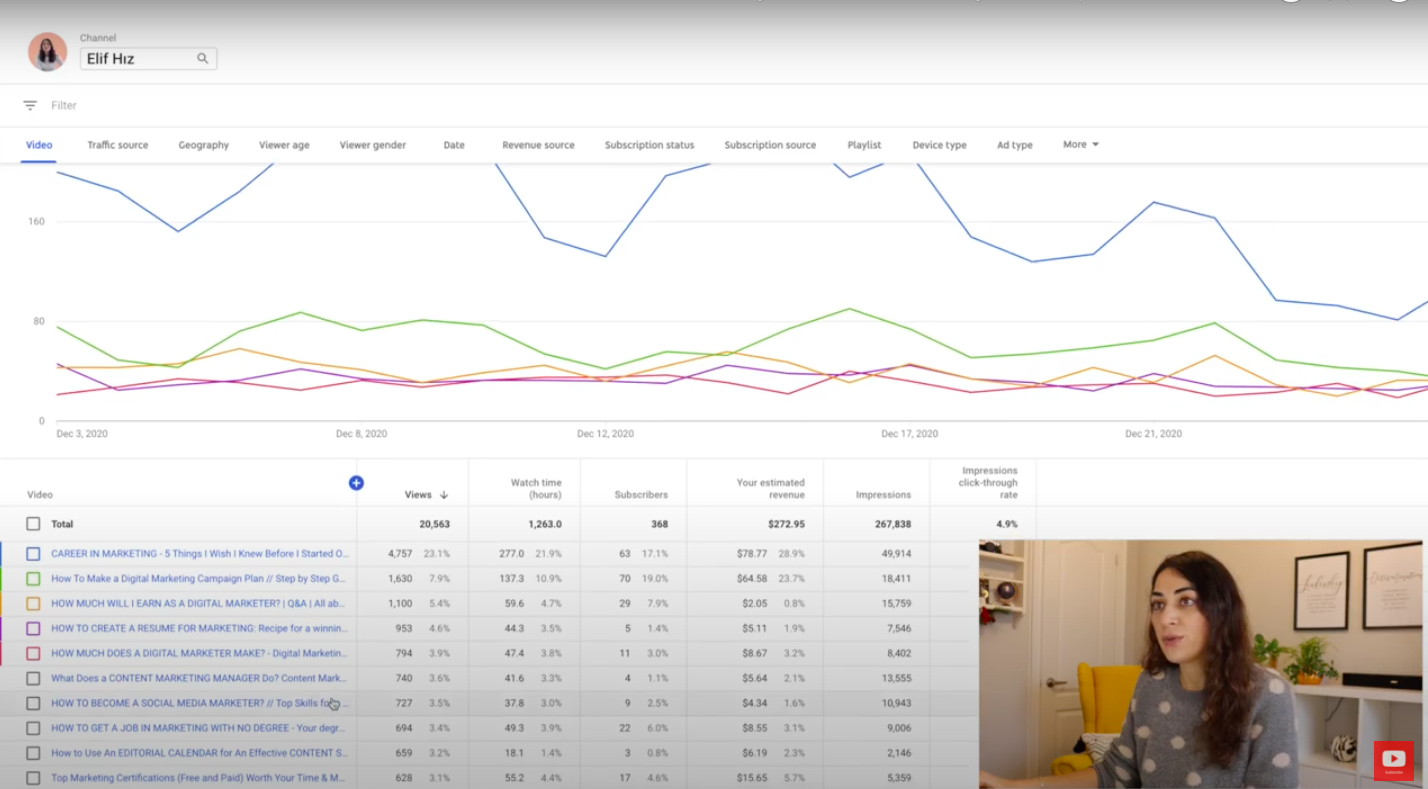
Let’s go back to the channel analytics graph on our analytics dashboard and take a more detailed look at the performance of our videos.
At the bottom of the graph, hit ‘see more’.
This will open up a more detailed line graph with multiple analytic metrics.
Line graphs and tables
Line graphs allow you to see how big of a difference your videos have in terms of performance.
You can clearly visualize which videos are really taking off, and which ones come nowhere close to your top performers that month.
Hit the blue plus button at the bottom of that page.
Now, you’ll be able to add more metrics to the table if you wanted to compare them to one another.

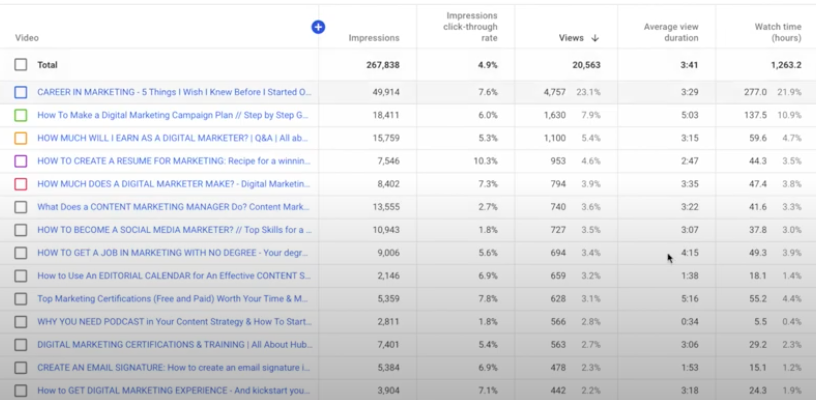
Video Analytics
Assessing the performance of your videos
I like to keep my dashboard simple and look at:
- Watch time (hours)
- Subscribers
- Estimated revenue
- Impression
- Impressions click-through-rate
But you can also judge the performance of your videos and see which topics are giving viewers the best value with these metrics:
- Revenue – the estimated revenue from all revenue types.
- Revenue per Mille (RPM) – how much revenue you receive per 1000 video playbacks.
- Playback-based CPM – the cost an advertiser pays for 1,000 video playbacks where an ad is displayed.
Let’s talk about Playback-based CPM and Impression CTR specifically.
1. Playback-based CPM
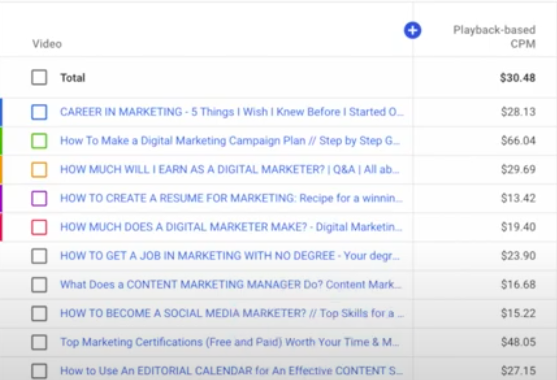
The number of views you have can be a good indication of how many people have watched your video. But the playback-based CPM can tell us a lot too.
Let’s say I have 2 videos.
- Video A has 6,000 views, and a playback-based CPM of $28.00.
- Video B has 2,000 views, but my playback-based CPM is $66.00.
Video B might have 3x less views compared to A.
But, it has MORE than double the playback-based CPM.
What that tells you is that while video A has more views, YouTube says (depending on where your viewers are coming from), you would be bringing home more cash if you had 1000 monetized views on video B from Ads.
But, it’s more than how much revenue a video has brought in that month.
Optimizing content strategy using playback-based CPM
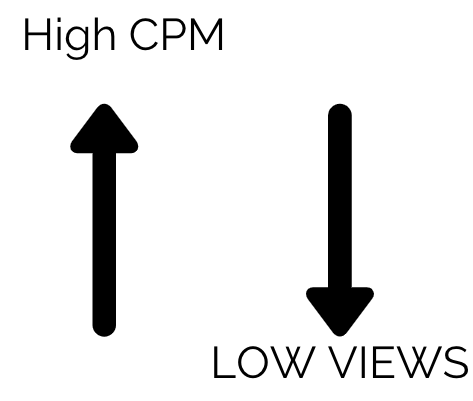
Views are not everything.
A video with high playback-based CPM (video B) but low views can signal that the video is more niche.
It’s specific to what people are searching for, and therefore more “valuable” in the eyes of Youtube, and you want value!
So if you’re wondering what type of content should I create more for my channel?
or what kind of content does my audience like best?
Use this as an indication.
Don’t worry too much about the views.
Instead, niche down and aim for higher CPM.
Or, take a more balanced approach and create a mix of content that your audience seems to really like.
2. Impression CTR
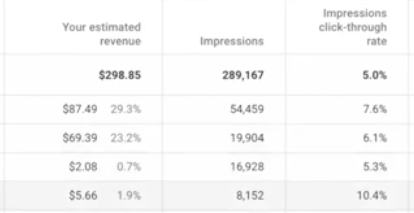
The impressions CTR is super important for both content creators AND YouTube.
It’s how YouTube decides how well the video is performing, and how you can decide whether you need to make a few changes to your graphic design game and title.
What do I mean by that?
When people scroll through YT and see your video there are two things that stand out:
- Title
- Thumbnail
Optimizing content strategy using Impression CTR
If your videos have really low CTR compared to others.
It could mean that you need to work on either the title or thumbnail of your video.
Tip:
- Get a second opinion by asking people on social media about which thumbnail is more enticing.
- Work on your keywords, and change a few things about your title.
3. Traffic source
Paying attention to your keywords, descriptions, tags, CTR, engagement, and watch time is important.
But so is paying attention to where your traffic is coming from.
You can learn about this by clicking on the ‘traffic source’ tab next to your video analytics tab.
Now, I might be competing with a lot of other well established marketers and big marketing and tech brands.
But, I don’t let that discourage me from making videos and producing great content.
Look at your top performing video.
Where is the traffic coming from?
Most of my traffic comes from YouTube search, and I use that to optimize out my content strategy.
Now, my main goal for my content is to rank my videos for YouTube search.
Meaning, I pay a huge amount of attention to my YouTube search SEO and impression CTR.
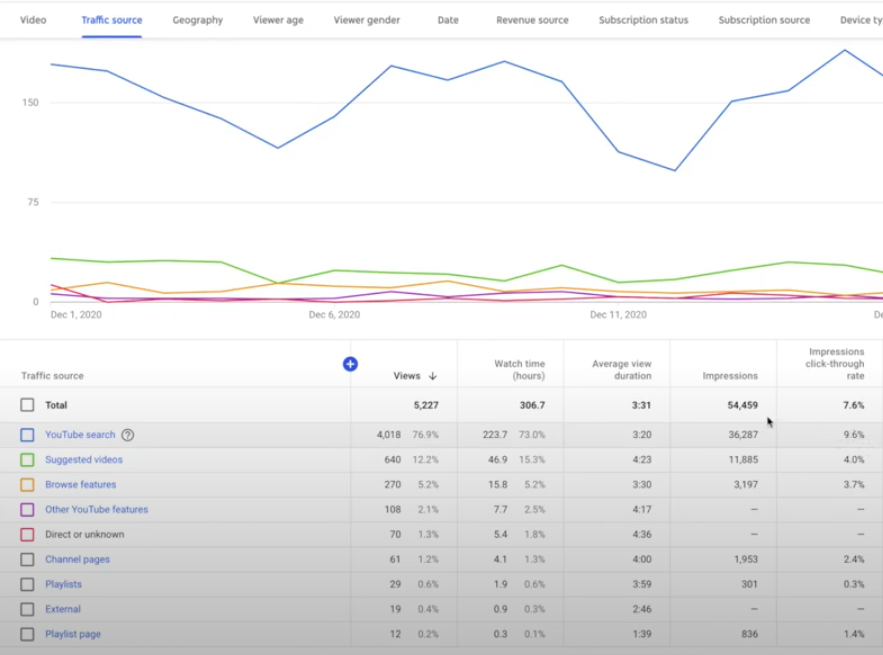
And..if you want to go through the other tabs to learn more about your audience demographics, for the specific video selected, this is where you would do so.
Go on and hit the geography, viewer age, viewer gender, and other buttons at the top to learn more about who is watching.
Audience analytics for the overall content
Now, let’s go back to the channel analytics page and hit ‘audience’ on the top panel .
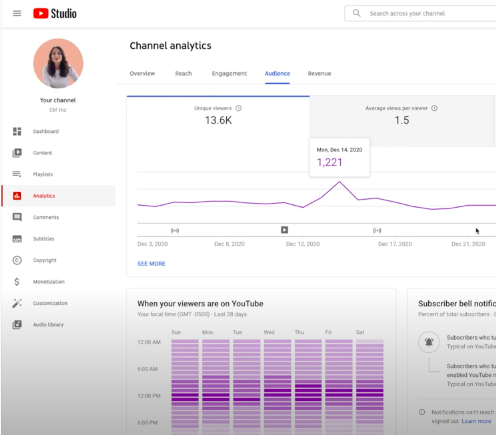
Here, you’ll find more information about your audience, when (time and day of the week) they’re on YouTube and top geographies (which is important when working with brands).
Engagement Analytics for the overall content
Your Engagement metrics will help you understand the following:
- Likes & Dislikes Ratio
- Comments
- Shares
- Audience retention rate
- Average view duration
- Total watch time (think of this like the bounce rate metric for websites
- Card and end screen reports
- Do people watch till the end and click to watch more content from your channel?
Click on the ‘engagement’ tab on the analytics page.
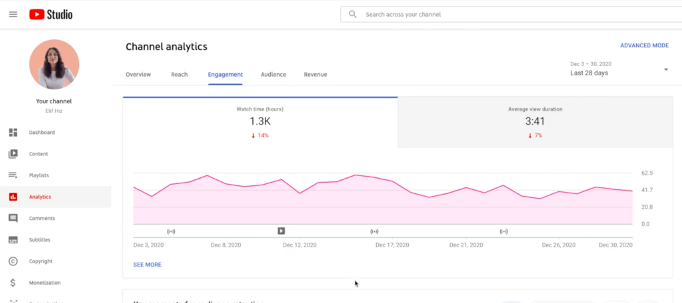
1. Watch time and view
Two important metrics in the engagement analytics are the watch time and average view duration.
Optimizing your content strategy using watch time and view duration
If your watch time and average view durations are low here are a few things that you can do to change it:
- Create longer videos
- Have a stronger intro to your videos
- Create stronger hooks
2. Key moments for audience retention
If you scroll down on the engagement dashboard, you’ll see the key moments for audience retention.
This, as described by Youtube is a measurement of
“how many people are still watching your video during your video playback. It also shows you when viewers stop watching.”
With this metric, you can see exactly where in LIVE time people exit out of your videos and use that knowledge to optimize your future content.
Optimizing your content strategy using audience retention
Is it a topic you don’t generally cover on your channel?
Are people not attracted to the topic because of a brand that you’ve mentioned in the first few seconds?
Try to brainstorm what might have caused people to exit your videos, and optimize your future content to improve audience retention.
3. Average view duration
Certain types of topics drive people to watch videos for longer periods on average compared to others.
Let me show you what I mean.
Let’s go back to viewing our channel analytics, and hit ‘see more’ below the channel analytics graph.
The average view duration on my channel is 3 minutes and 41 seconds.
That’s not very long given that my videos are anywhere from 10 – 30 minutes long.
Optimizing your content strategy using the average view duration metric
If you want to increase your view duration on your channel, then look at the topics that are keeping people hooked on your content and the type of videos.
- What is it that people really like?
- What topics do they enjoy?
- What types of videos are they?
Are they tutorials? Vlogs? How-to-videos? Advice videos? Step-by-step videos?
For instance, if you create career related videos like I do, then maybe, that’s something that you can produce more of.
Viewers like watching career stories because they are looking for pieces of your story that resonate with them.
But the key here is to find out what your viewers enjoy and want, and to optimize your future content knowing this new piece of information.
Reach Analytics for the overall content
Your reach metrics help you understand the following:
- Subscriber growth
- Views (how many views/day/month)
- Video subscribers
- Impressions
- Impressions CTR
- Traffic sources
- Youtube search terms
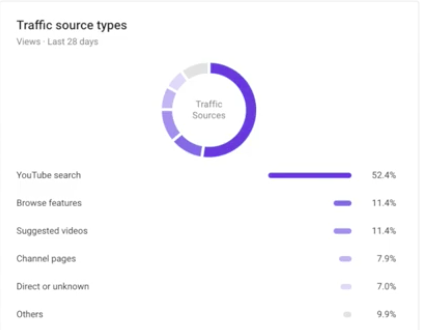
Let’s talk about traffic source types.
Traffic Source Types
As i mentioned earlier, my top priority is to rank on YouTube search, and bring my viewers to my content through YouTube.
The traffic source funnel is a great place to visualize whether or not I’m achieving that goal and doing well on my YouTube SEO.
Conclusion
Now that you understand the basics of YouTube Analytics, and the different strategies you can use to optimize your content, you should be able to answer the following questions:
- What type of content performs best?
- How can I improve my watch time?
- What time should I post content?
- How interesting and relevant is my content for my audience?
- How much time has my audience invested in my content? Have they finished consuming it?
- Where is my audience dropping off? Is there anything I can take from this?
- Why have they dropped off and what can I change to improve my content next time?
In the second part of this series, I’ll be going over in more detail how you can plan your content strategy and grow your channel even further by using YouTube Analytics in more detail.